Do you want to learn how to visualize topographic data? How we can view a 3D function? Can we display specific functions in 3D like activation functions in AI ? How can we create a 3D map in C++?
Topographic Data are data sets about the elevation of the a surface, generally surface of the Earth. Two such data types are commonly used, the first is the Digital Topographic Data that represent the information typically found on a topographic quadrangle map, and the second is the Dgitial Evelation Models (DEM) composed with grids of data. The first data model, typically found on a topographic quadrangle map, such as contour lines, roads, streams, railroads, towns, etc. For simplicity, this first category of data will be referred to as digital topographic map data. The second are Digital Elevation Models or DEMs, composed with grids of data, for which each cell in the grid represents the elevation at a certain point on the Earth.
C++ Builder is easy to build this kind of simple visualizations. C++ is a fast programming language that allows you to develop fully native applications which run at the full speed of the machine. You can use OpenGL or Direct3D libraries or some other 3rd party 3D Engines. In C++ IDE, you can directly create your own 3D objects, you can animate them on runtime. Viewport3D (TViewportd3D) component in C++ Builder FireMonkey projects is good to display many basic 3D Objects like Plane, Cube, Sphere, Cone, Plane, Ellipse3D etc. Please see this post about Working With 3D In Modern Windows C++ Development for creating these 3D objects. You can also easily load your 3D objects into Viewport3D by using Model3D (TModel3D).
To create a 3D object to be used in Viewport3D we need to use TMesh classes. TMesh is a custom 3D shape that can be customized by drawing 3D shapes. It is a class publishes a set of properties from its ancestor, TCustomMesh, in order to let you design new 3D shapes at design time from within the IDE, through the Object Inspector. Use the Data property to specify the points, normals and textures for each point, and the order in which the resulting triangles are drawn. The designed shape is filled with the material specified through MaterialSource property. If no material is specified, then the shape is filled with red color.
Table of Contents
Viewport3D
Viewport3D (TViewport3D) is a 3Dcomponent to display 3D objects in its space. TViewport3D implements IViewport3D methods to describe how a 3D object is seen. It is really simple and nice to develop some small 3D games or adding some 3D features in your applications. Viewport3D is a component that shows the view port of the camera or default view. You can arrange it’s position, Width and Height on any place of your form or you can use it in client view to do full screen. We can use viewport3D without a 3D Camera, it is using its own design camera view. If you want to use camera and want to see view from the view of that camera you must set its UseDesignCamera property to false from its properties or as below;
|
1 2 3 |
Viewport3D1->UseDesignCamera=false; |
You can update any objects in Viewport3D with BeginUpdate(), EndUpdate() methods as given below;
|
1 2 3 4 5 |
Viewport3D1->BeginUpdate(); // Move or set Objects, Cameras, Lights here Viewport3D1->EndUpdate(); |
This will update full 3D matrix of Viewport3D in one time. You can also change background color of this Viewport3D component like this;
|
1 2 3 |
Viewport3D1->Color=claBlack; |
What does TPlane do?

The TPlane is used in Viewport3D component, it is a class implements a 2D plane that can be placed on a 3D FireMonkey form, it represents a 2D plane that can be employed in a 3D form. Planes support 3D rotation and alignment. TPlane is a visual object that can be added from the Tool Palette.
|
1 2 3 4 5 6 7 8 9 10 11 12 13 14 15 16 17 18 19 |
Plane1->BeginUpdate(); Plane1->Width=10; Plane1->Height=10; Plane1->SubDivisionsHeight=10; Plane1->SubDivisionsWidth=10; Plane1->Position->X=0; Plane1->Position->Y=0; Plane1->Position->Z=0; Plane1->Rotation->X=0; Plane1->Rotation->Y=0; Plane1->Rotation->Z=0; Plane1->MaterialSource =TextureMaterialSource1; //MaterialSources should be defined or dragged Plane1->EndUpdate(); |
We can use TPlane to display each parts of faces. But using TMesh is much more simple and easy to setup 4 corner nodes.
How does TMesh help us with visualizations?
Use TMesh to display 3D topographic data. 3D faces, 3D Functions, 3D ground shapes and any other data can be displayed by using TPlane and its 4 coordinates.
TMesh represents a 3D shape that can be customized. The TMesh class publishes a set of properties from its ancestor, TCustomMesh, in order to let you design new 3D shapes at design time from within the IDE, through the Object Inspector.
Use the Data property to specify the points, normals and textures for each point, and the order in which the resulting triangles are drawn. The designed shape is filled with the material specified through MaterialSource property. If no material is specified, then the shape is filled with red color.
|
1 2 3 4 5 6 7 8 9 |
TMesh *mesh=new TMesh(Form1->Dummy1); mesh->Parent=Form1->Dummy1; // .... // when done free from the memory mesh->Free(); |
How To Generate Topographic Data in C++
In our example we will used TMesh to display surfaces and we will use Digital Elevation Model (DEM) . We will create our own data with x and y coordinates and its z elevation. Let’s define our 100×100 grid data and a TMesh object first.
|
1 2 3 4 5 6 7 |
#define GRIDSX 100 #define GRIDSY 100 double data[GRIDSX][GRIDSY]; TMesh *mesh; |
Now let’s generate a data. We can generate a random data as remmed below or we can use a 3D function as given below.
|
1 2 3 4 5 6 7 8 9 10 11 12 13 14 15 16 17 18 19 20 21 22 |
void generate_topographic_data() { srand(time(0)); float ev= 1.0; for(int j=0; j<GRIDSY; j++) for(int i=0; i<GRIDSX; i++) { data[i][j] = 0.005*(pow(i-GRIDSX*0.5,2)+pow(j-GRIDSY*0.5,2)); } /* for(int j=0; j<GRIDSY; j++) for(int i=0; i<GRIDSX; i++) { if(rand()%5==1) data[i][j]+= (50-rand()%100)/100.0; } */ } |
Generating Topographic 3D Mesh from the Data
We can generate each planes of the Mesh with 4 points from the grid data, each point will have x,y,z and we can scale this to have better visualization. See how it works below,
|
1 2 3 4 5 6 7 8 9 10 11 12 13 14 15 16 17 18 19 20 21 22 23 24 25 26 27 28 29 30 31 32 33 34 35 36 37 38 39 40 41 42 43 44 45 46 47 48 49 50 51 52 53 54 55 56 57 58 59 60 61 62 63 64 65 66 67 68 69 70 71 72 73 74 75 76 77 78 79 80 81 82 83 84 85 86 87 88 89 90 91 92 93 |
void generate_topographic_mesh() { TPoint3D P0,P1,P2,P3; int NP=0, NI=0; float scale =2, scaleZ=2.0; float OX = GRIDSX*scale/2; float OY = GRIDSY*scale/2; if(mesh!=NULL) mesh->Free(); mesh=new TMesh(Form1->Dummy1); mesh->Parent=Form1->Dummy1; mesh->Width=1; mesh->Height=1; mesh->Depth=1; mesh->Position->X=0; mesh->Position->Y=0; mesh->Position->Z=0; mesh->Scale->X=1; mesh->Scale->Y=1; mesh->Scale->Z=1; mesh->RotationAngle->X=0; mesh->RotationAngle->Y=0; mesh->RotationAngle->Z=0; mesh->RotationCenter->X=0; mesh->RotationCenter->Y=0; mesh->RotationCenter->Z=0; mesh->WrapMode=TMeshWrapMode::Original; mesh->TwoSide=true; mesh->Visible=true; mesh->Opacity=1.0; mesh->Data->Clear(); mesh->Data->VertexBuffer->Length=4*GRIDSX*GRIDSY; mesh->Data->IndexBuffer->Length= 6*GRIDSY*GRIDSY; for(int j=0; j<GRIDSY-1; j++) for(int i=0; i<GRIDSX-1; i++) { P0.X = i*scale-OX; P0.Y = data[i][j]*scaleZ; P0.Z = j*scale-OY; P1.X = (i+1)*scale-OX; P1.Y = data[i+1][j]*scaleZ; P1.Z = j*scale-OY; P2.X = (i+1)*scale-OX; P2.Y = data[i+1][j+1]*scaleZ; P2.Z = (j+1)*scale-OY; P3.X = i*scale-OX; P3.Y = data[i][j+1]*scaleZ; P3.Z = (j+1)*scale-OY; mesh->Data->VertexBuffer->Vertices[NP+0] = P0; mesh->Data->VertexBuffer->Vertices[NP+1] = P1; mesh->Data->VertexBuffer->Vertices[NP+2] = P2; mesh->Data->VertexBuffer->Vertices[NP+3] = P3; mesh->Data->VertexBuffer->TexCoord0[NP+0] =PointF(0, (P0.Y+35)/45); mesh->Data->VertexBuffer->TexCoord0[NP+1] =PointF(0, (P0.Y+35)/45); mesh->Data->VertexBuffer->TexCoord0[NP+2] =PointF(0, (P0.Y+35)/45); mesh->Data->VertexBuffer->TexCoord0[NP+3] =PointF(0, (P0.Y+35)/45); //mesh->Data->Normals="....."; mesh->Data->IndexBuffer->Indices[NI+0] =NP+0; mesh->Data->IndexBuffer->Indices[NI+1] =NP+2; mesh->Data->IndexBuffer->Indices[NI+2] =NP+1; mesh->Data->IndexBuffer->Indices[NI+3] =NP+0; mesh->Data->IndexBuffer->Indices[NI+4] =NP+3; mesh->Data->IndexBuffer->Indices[NI+5] =NP+2; NP+=4; NI+=6; } mesh->MaterialSource=Form1->LightMaterialSource1; mesh->Data->CalcFaceNormals(true); mesh->Repaint(); } |
Full Example to Topographic 3D Mesh
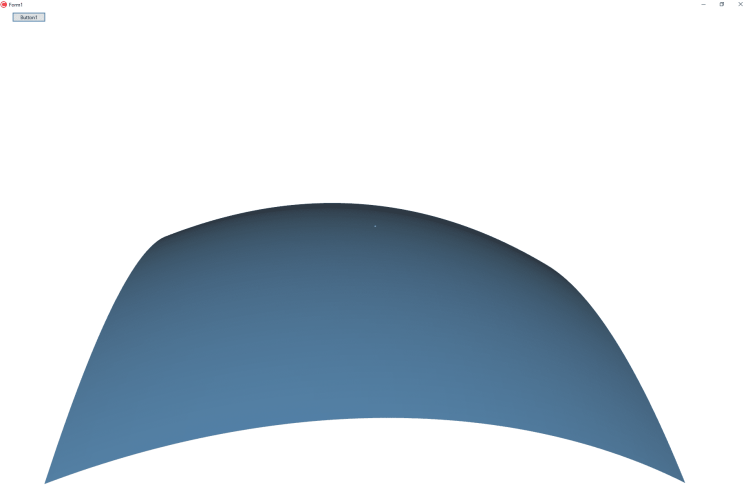
Here is the screenshot of the fully maximized C++ Builder FMX example. Here we have 100×100 grid and a functional elevation.

If we randomly generate data by using remmed lines of generate_topographic_data() above, we can see this.

Whole codes of this example is listed below,
|
1 2 3 4 5 6 7 8 9 10 11 12 13 14 15 16 17 18 19 20 21 22 23 24 25 26 27 28 29 30 31 32 33 34 35 36 37 38 39 40 41 42 43 44 45 46 47 48 49 50 51 52 53 54 55 56 57 58 59 60 61 62 63 64 65 66 67 68 69 70 71 72 73 74 75 76 77 78 79 80 81 82 83 84 85 86 87 88 89 90 91 92 93 94 95 96 97 98 99 100 101 102 103 104 105 106 107 108 109 110 111 112 113 114 115 116 117 118 119 120 121 122 123 124 125 126 127 128 129 130 131 132 133 134 135 136 137 138 139 140 141 142 143 144 145 146 147 148 149 150 151 152 153 154 155 156 157 158 159 160 161 162 163 164 165 166 167 168 169 |
//--------------------------------------------------------------------------- #include <fmx.h> #include <time.h> #pragma hdrstop #include "DataVisualization3D_TopographicData_Unit1.h" //--------------------------------------------------------------------------- #pragma package(smart_init) #pragma resource "*.fmx" TForm1 *Form1; #define GRIDSX 100 #define GRIDSY 100 double data[100][100]; TMesh *mesh; float LX,LY; bool rotation=false; //--------------------------------------------------------------------------- __fastcall TForm1::TForm1(TComponent* Owner) : TForm(Owner) { } //--------------------------------------------------------------------------- void generate_topographic_data() { srand(time(0)); float ev= 1.0; for(int j=0; j<GRIDSY; j++) for(int i=0; i<GRIDSX; i++) { data[i][j] = 0.005*(pow(i-GRIDSX*0.5,2)+pow(j-GRIDSY*0.5,2)); } //for(int ev=0; ev<5; ev++) /* for(int j=0; j<GRIDSY; j++) for(int i=0; i<GRIDSX; i++) { if(rand()%5==1) data[i][j]+= (50-rand()%100)/100.0; } */ } //--------------------------------------------------------------------------- void generate_topographic_mesh() { TPoint3D P0,P1,P2,P3; int NP=0, NI=0; float scale =2, scaleZ=2.0; float OX = GRIDSX*scale/2; float OY = GRIDSY*scale/2; if(mesh!=NULL) mesh->Free(); mesh=new TMesh(Form1->Dummy1); mesh->Parent=Form1->Dummy1; mesh->Width=1; mesh->Height=1; mesh->Depth=1; mesh->Position->X=0; mesh->Position->Y=0; mesh->Position->Z=0; mesh->Scale->X=1; mesh->Scale->Y=1; mesh->Scale->Z=1; mesh->RotationAngle->X=0; mesh->RotationAngle->Y=0; mesh->RotationAngle->Z=0; mesh->RotationCenter->X=0; mesh->RotationCenter->Y=0; mesh->RotationCenter->Z=0; mesh->WrapMode=TMeshWrapMode::Original; mesh->TwoSide=true; mesh->Visible=true; mesh->Opacity=1.0; mesh->Data->Clear(); mesh->Data->VertexBuffer->Length=4*GRIDSX*GRIDSY; mesh->Data->IndexBuffer->Length= 6*GRIDSY*GRIDSY; for(int j=0; j<GRIDSY-1; j++) for(int i=0; i<GRIDSX-1; i++) { P0.X = i*scale-OX; P0.Y = data[i][j]*scaleZ; P0.Z = j*scale-OY; P1.X = (i+1)*scale-OX; P1.Y = data[i+1][j]*scaleZ; P1.Z = j*scale-OY; P2.X = (i+1)*scale-OX; P2.Y = data[i+1][j+1]*scaleZ; P2.Z = (j+1)*scale-OY; P3.X = i*scale-OX; P3.Y = data[i][j+1]*scaleZ; P3.Z = (j+1)*scale-OY; mesh->Data->VertexBuffer->Vertices[NP+0] = P0; mesh->Data->VertexBuffer->Vertices[NP+1] = P1; mesh->Data->VertexBuffer->Vertices[NP+2] = P2; mesh->Data->VertexBuffer->Vertices[NP+3] = P3; mesh->Data->VertexBuffer->TexCoord0[NP+0] =PointF(0, (P0.Y+35)/45); mesh->Data->VertexBuffer->TexCoord0[NP+1] =PointF(0, (P0.Y+35)/45); mesh->Data->VertexBuffer->TexCoord0[NP+2] =PointF(0, (P0.Y+35)/45); mesh->Data->VertexBuffer->TexCoord0[NP+3] =PointF(0, (P0.Y+35)/45); //mesh->Data->Normals="....."; mesh->Data->IndexBuffer->Indices[NI+0] =NP+0; mesh->Data->IndexBuffer->Indices[NI+1] =NP+2; mesh->Data->IndexBuffer->Indices[NI+2] =NP+1; mesh->Data->IndexBuffer->Indices[NI+3] =NP+0; mesh->Data->IndexBuffer->Indices[NI+4] =NP+3; mesh->Data->IndexBuffer->Indices[NI+5] =NP+2; NP+=4; NI+=6; } mesh->MaterialSource=Form1->LightMaterialSource1; mesh->Data->CalcFaceNormals(true); mesh->Repaint(); } void __fastcall TForm1::Button1Click(TObject *Sender) { generate_topographic_data(); generate_topographic_mesh(); Viewport3D1->Repaint(); } void __fastcall TForm1::Viewport3D1MouseDown(TObject *Sender, TMouseButton Button, TShiftState Shift, float X, float Y) { LX=X; LY=Y; rotation=true; } //--------------------------------------------------------------------------- void __fastcall TForm1::Viewport3D1MouseUp(TObject *Sender, TMouseButton Button, TShiftState Shift, float X, float Y) { rotation=false; } //--------------------------------------------------------------------------- void __fastcall TForm1::Viewport3D1MouseMove(TObject *Sender, TShiftState Shift, float X, float Y) { if(rotation) { Dummy1->RotationAngle->X=(Y-LY)*0.4; Dummy1->RotationAngle->Y=(LX-X)*0.4; } } //--------------------------------------------------------------------------- |
As given here, you can generate your own 3D topography, you can add texture on to this mesh, you can also create different textured meshes for the rivers and mountains etc. You can create color textures and you can show the elevation in colors. You can use this method to display your functions i.e. Activation Functions in Artificial Intelligence. You can develop 3D games which has random or well designed topographical maps as given example above. Note that there are a lot of topographic data in internet. For example you can get these kinds of data from https://opentopography.org/
C++ Builder is really great, there no limit to do your dreams ! Just dream and code for it !
Design. Code. Compile. Deploy.
Start Free Trial
Free C++Builder Community Edition

